Capture Logs and Analyze Crashes
The SDK's debug_logging and crash_analysis guides are complementary: logs explain what the two cores were doing, while a captured memory image lets a debugger recover the failing context. Keep the exact ELF, map/symbol files, SDK revision, chip model, configuration, and board revision with every capture.
Choose a debug connection
| Family/source path | Debug and log behavior |
|---|---|
| SF32LB52x, SF32LB56x, SF32LB58x | The source guide documents UART capture, SifliUsartServer/AssertDumpUart, and J-Link/Trace32 recovery. Use the transport that remains available in the selected sleep state. |
| SF32LB55x | SWD can be switched between HCPU and LCPU with $SDK_ROOT/tools/segger/jlink_hcpu_a0.bat and jlink_lcpu_a0.bat. LCPU's ROM console is UART3 at 1,000,000 baud; HCPU can use UART1/2 or SWD. Because SWD uses PB IO, keep LPSYS active or in light sleep while connected. |
When LPSYS wakes from standby, SWD returns to HCPU. A J-Link reset does not itself switch the selected core. If asynchronous logging is enabled, an assert dump can be truncated; use a synchronous or retained capture for the failure path.
Capture a live or post-mortem package
For current SDK releases, capture over UART or J-Link with sdk.py:
Example scope
The command below is an SF32LB52/LB525 example. Keep the command structure, but replace the chip/model, core, transport, and ELF with values supported by the target family and SDK release.
sdk.py crash-dump capture-live --transport uart --probe /dev/ttyUSB0 \
  --chip SF32LB52 --chip-model LB525 \
  --output /tmp/live-crash --elf build_hcpu/main.elf
Add --include-psram --psram-size 8MB when the target uses PSRAM. A J-Link probe can use --transport jlink --jlink-ip 127.0.0.1:19025; select the affected core with --core hcpu or --core lcpu. The output directory should contain the captured binary, core ELF/AXF, log.txt, manifest.json, and sdk_manifest.json.
For older SDKs, use the family-specific method in the source guide:
- UART:
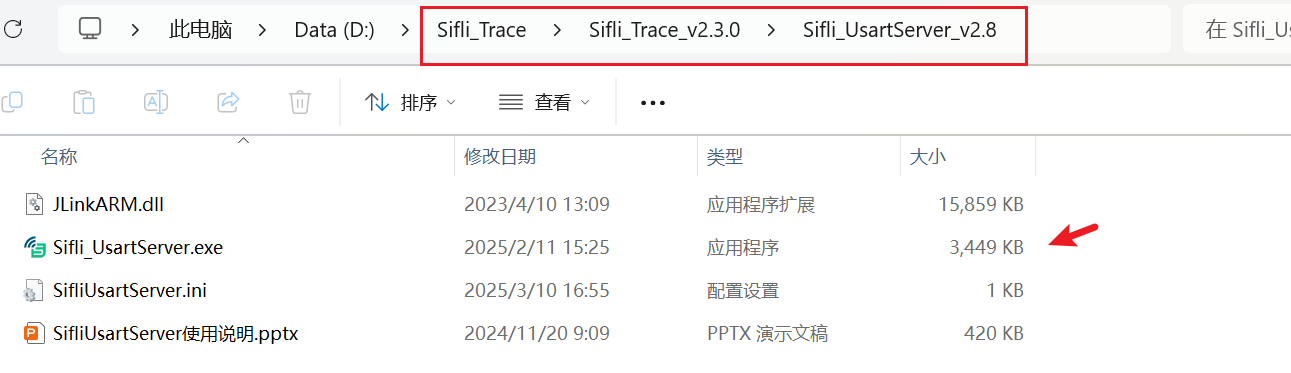
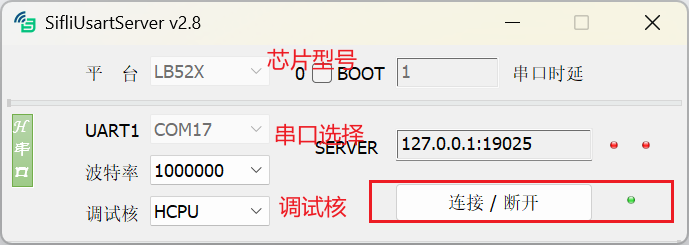
SifliUsartServerorAssertDumpUartcan export an assertion package while the console is available. - J-Link/SWD: on 55x, run
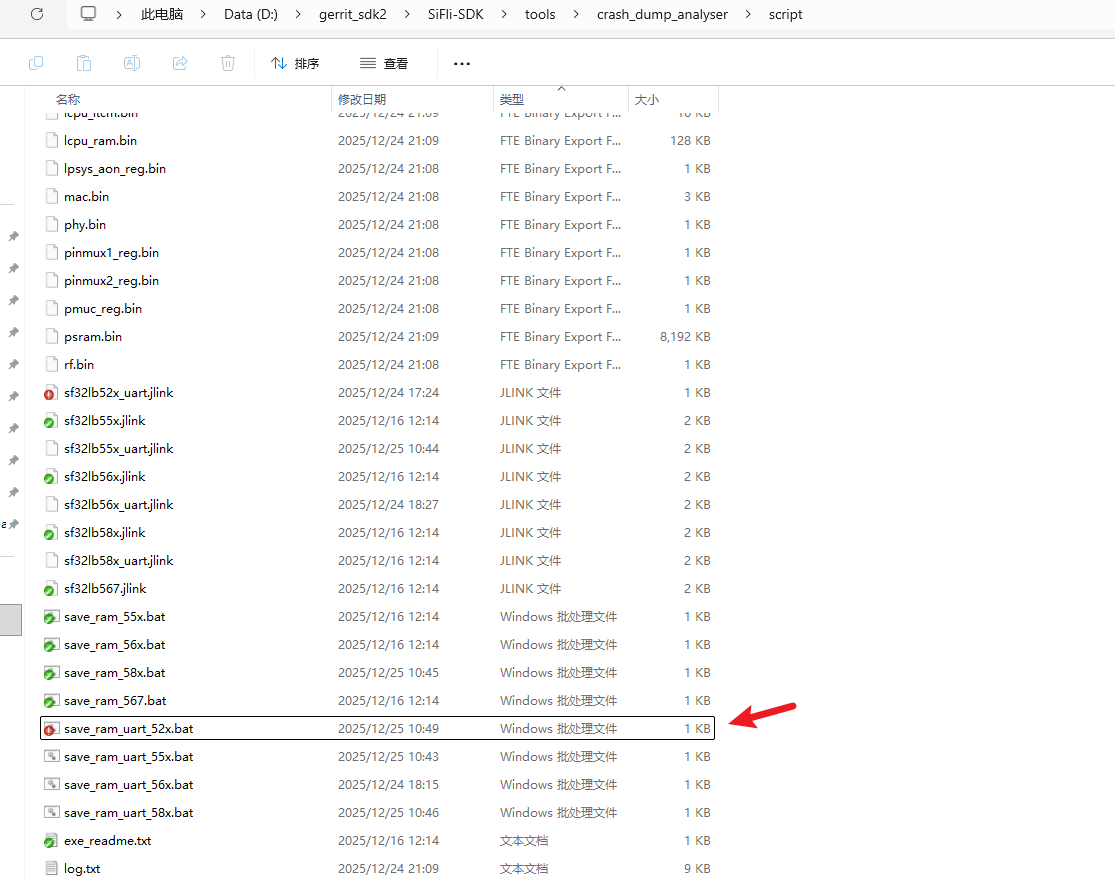
$SDK_ROOT/tools/crash_dump_analyser/script/save_ram_a0.batafter putting J-Link onPATH; this saves RAM, EPIC registers, and PSRAM. - Ensure
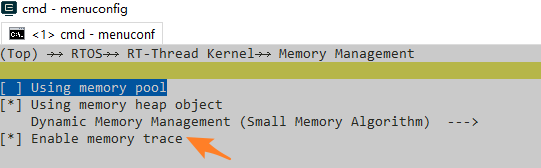
RTOS → RT-Thread Kernel → Memory Management → Enable memory traceis enabled when heap-leak evidence is needed.
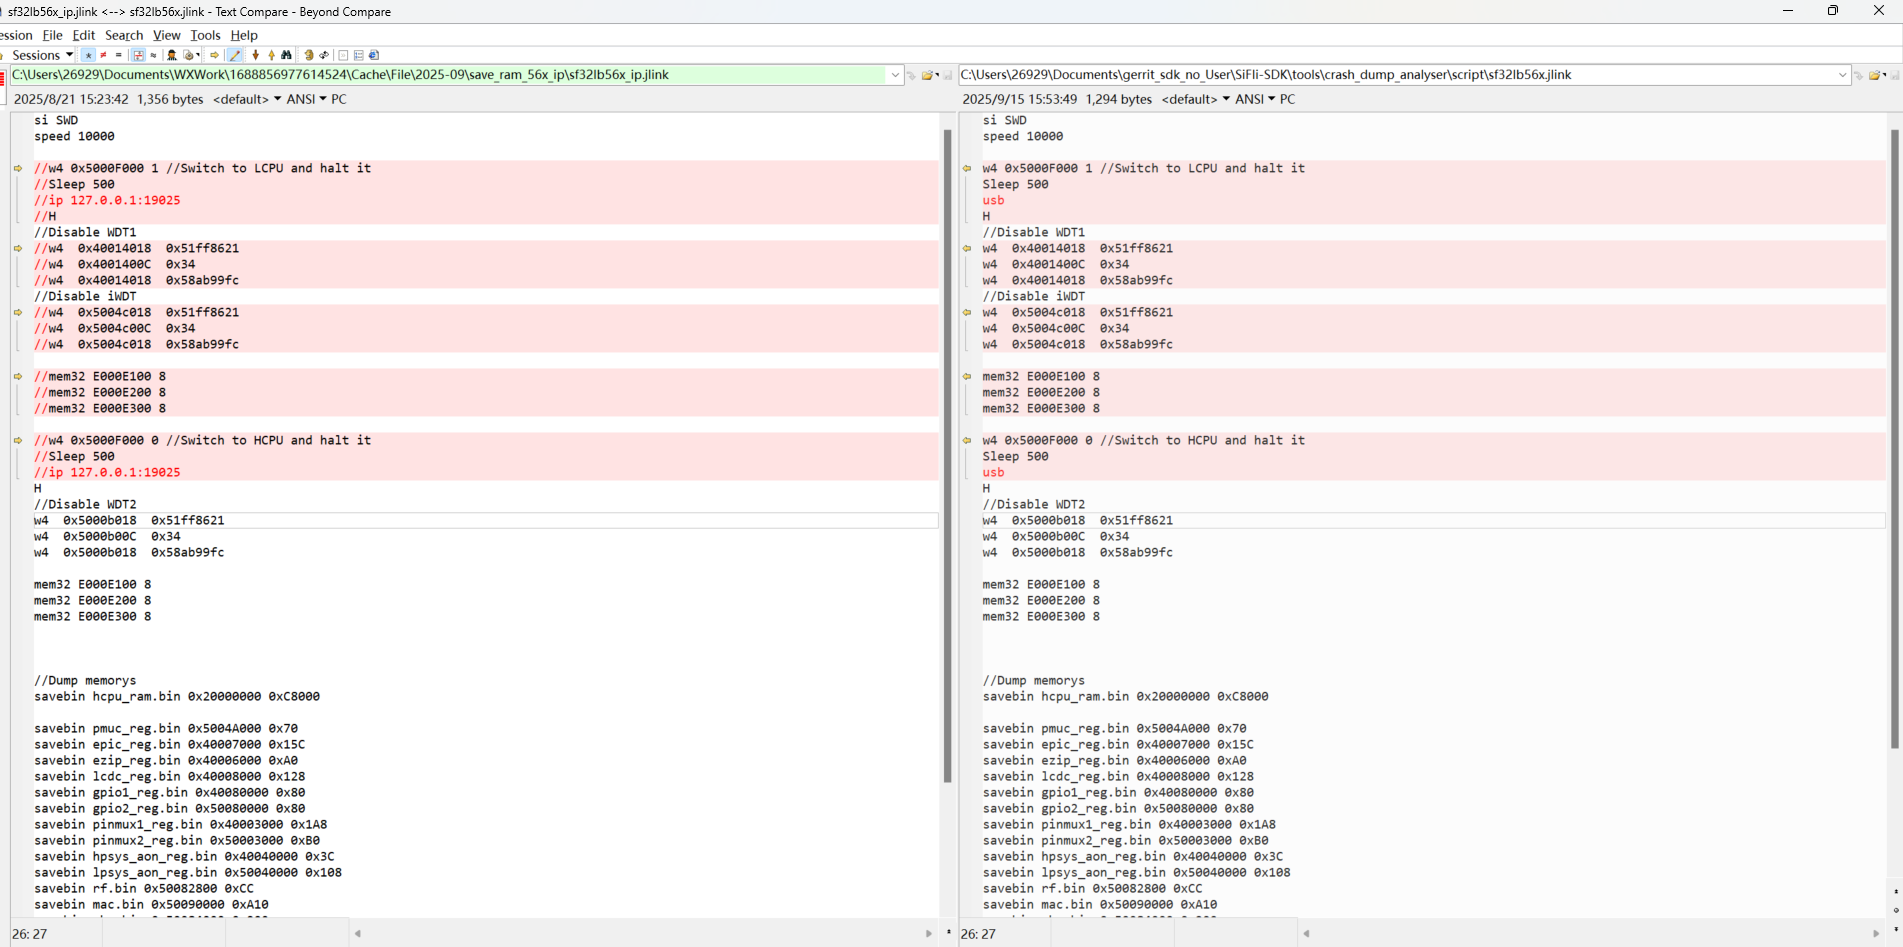
UART capture normally requires matching the serial utility, server address, and target core. The two source screenshots below are useful connection checks:
Restore and analyze the context
Convert a captured package to a debugger-readable core and analyze it with the matching ELF:
sdk.py crash-dump readcore --package /tmp/live-crash \
  --elf build_hcpu/main.elf --output /tmp/live-crash/coredump.elf
sdk.py crash-dump analyze --core /tmp/live-crash/coredump.elf \
  --elf build_hcpu/main.elf
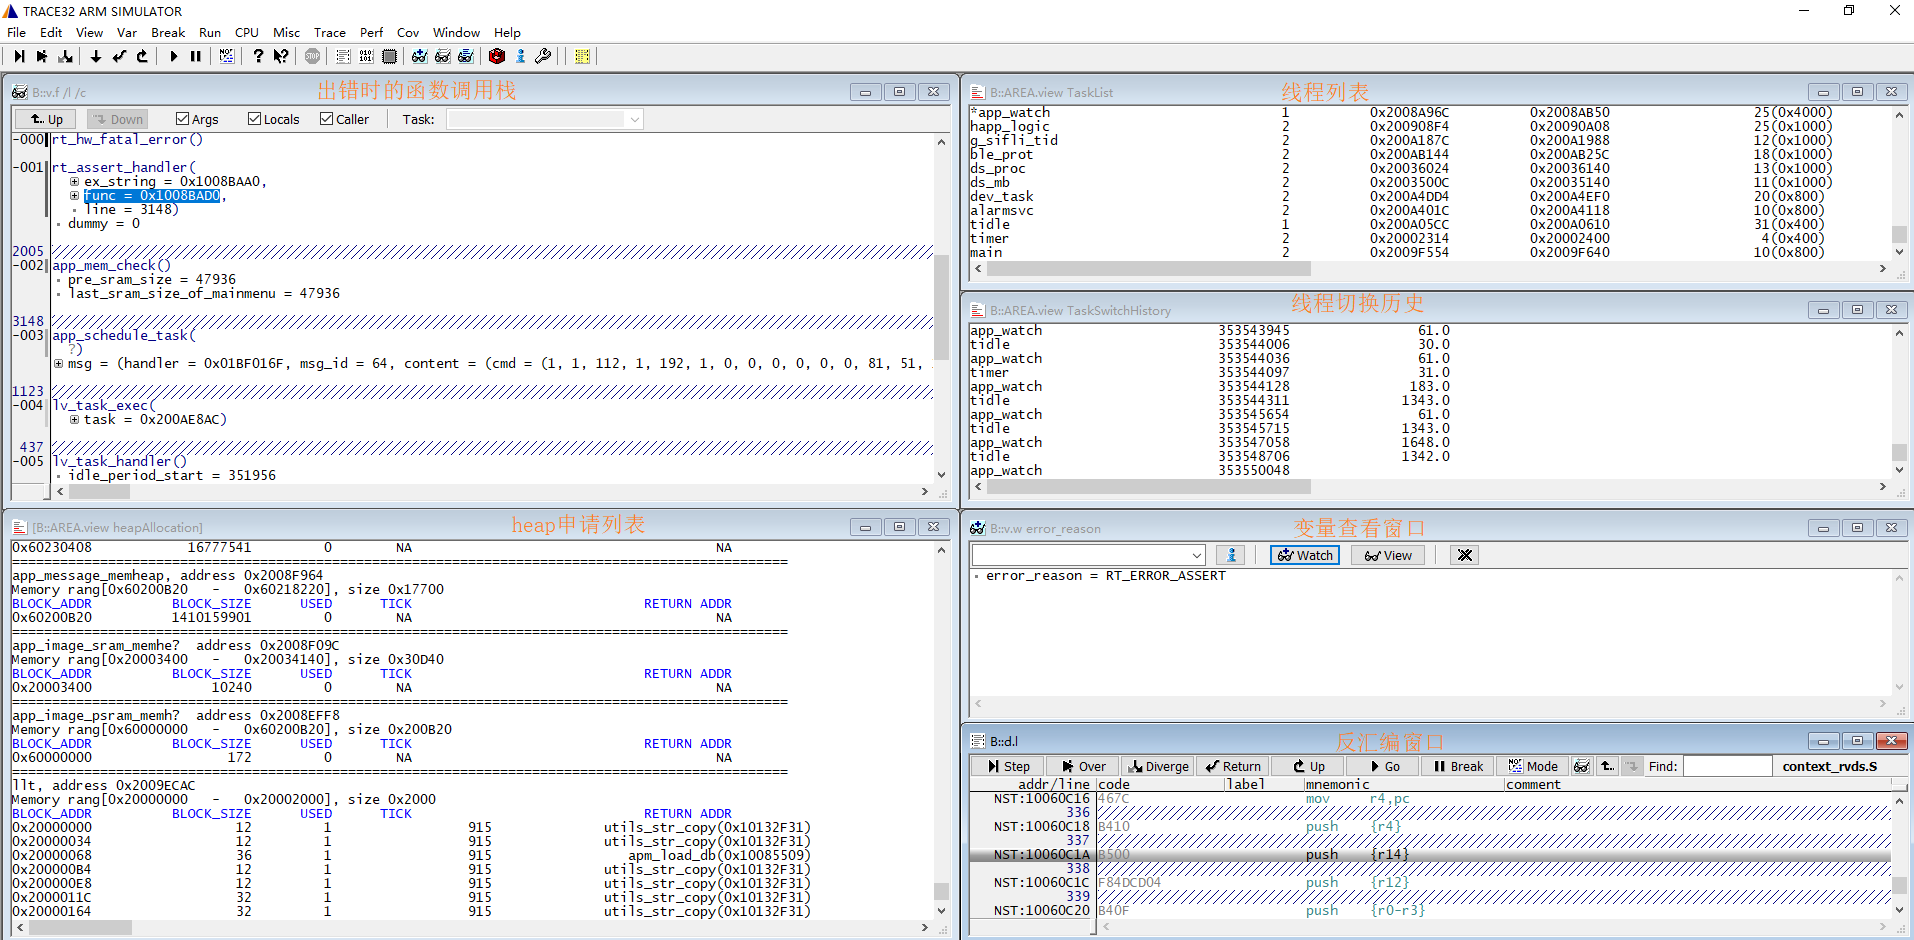
The older Trace32 workflow loads an HCPU assertion package with the HCPU assertion (HA) button and run_next_step; use the LCPU recovery configuration for an LCPU dump. If no exception stack is displayed, verify the core selection, ELF, and memory ranges before interpreting registers.
Stop early during boot or a suspected race
To debug initialization, uncomment the first instruction in the matching Reset_Handler so it becomes B .:
The startup-file paths below are SF32LB55x source paths; use the corresponding startup files for another family.
- HCPU:
$SDK_ROOT/drivers/cmsis/sf32lb55x/Templates/arm/startup_bf0_hcpu.S - LCPU:
$SDK_ROOT/drivers/cmsis/sf32lb55x/Templates/arm/startup_bf0_lcpu.S
Connect J-Link and advance the PC by two bytes to continue. In C, _asm("B ."); creates the same intentional stop. Do not replace it with while (1);; the compiler may optimize away code after the loop.
Read the evidence
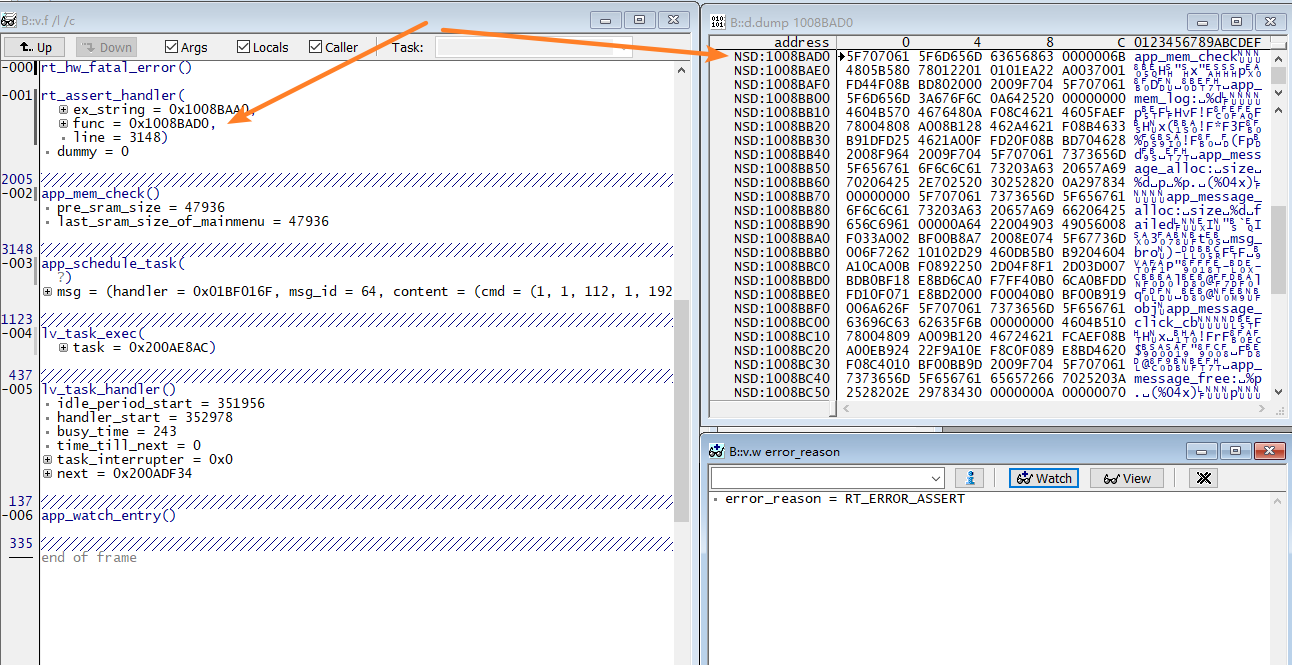
An assertion dump normally includes the assertion function and line, thread table, mailbox and message-queue state, mutexes, semaphores, heap usage, and CPU registers. Correlate the failing PC with the exact ELF, then check stack headroom, blocked owners, queue entries, and the last log before the failure. Preserve the raw dump before symbolizing it.
For interactive inspection, Ozone can load the HCPU/LCPU ELF and the matching Cortex-M33-with-FPU SVD from $SDK_ROOT/tools/svd_external. Use UART or SifliUsartServer when the core is in a state where SWD cannot attach. ULOG can use UART, and Segger RTT can be selected as the RT-Thread log device after enabling RTT support.
Instrument bus and memory failures
The SDK bus monitor can capture accesses that lead to a bus fault. Register a callback with dbg_busmon_reg_callback, then use dbg_busmon_read and dbg_busmon_write from the source example to inspect the relevant address range. Pair this with heap tracing and the crash package; a register dump without symbols or memory context is rarely sufficient.
Official family sources: SF32LB52x crash analysis, SF32LB55x, SF32LB56x, SF32LB58x, and the matching debugging and logging guide.